
You will be happy to know that India is the third largest country in power generation and consumption. The total installed capacity of electric generation is 472.5 GW as on April,2025. Out of that fossil sources(Coal and diesel power plants) contribute 248.9GW and remaining 223.6 GW from non-fossil sources(renewable + nuclear + hydro) .Electricity consumption is India is gradually increasing @ 9.5% per year ,the consumption was around 1,694 BU (billion units) in the year 2024-24 .The peak demand of India is also gradually increasing @6-7% and projected at 277GW by the year 2026.
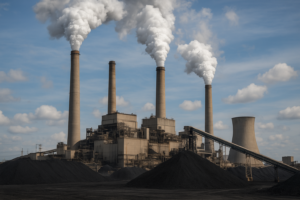
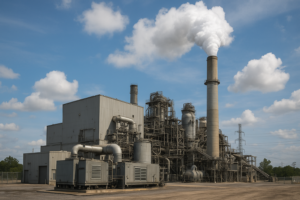
Though now major power demand of the country is satisfied by fasil sources and is a major threat to our environment due to green house effect. A coal based power plant uses 2300 to 2600 kcal to produce one unit of electricity with emission 0.8 to1.1 kilogram of carbon dioxide. To protect the environment government have changed their policy decision and emphasizing on green energy .i,e energy from solar and hydro power plants and wind mills. In power plant infrastructure, priority is being given to produce more green energy of our maximum demand.Let us have look on non fosil/renewable energy infrastructure.
Non fosil power Infrastructure(2024-25)
|
Sources |
Installed Capacity(GW) |
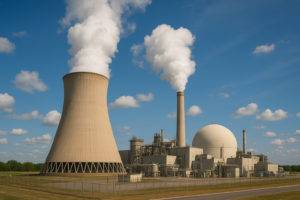
| Nuclear |
8.9 |
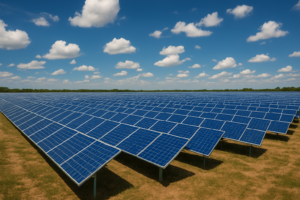
| Solar | 105-110 |
| wind | 50-51 |
| Hydro |
47-52 |
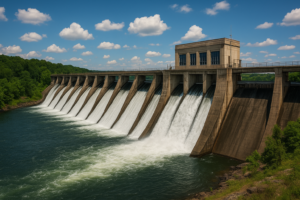
Illustration of different types of power plants such as coal based,diesel based,nuclear ,hydro,solar and wind mills:
 Renewables are being added rapidly; India has a goal of reaching 500 GW of non-fossil (renewable + nuclear + large hydro) capacity by 2030.
Transmission & grid infrastructure is being upgraded to handle increased demand and improved reliability.
Major challenges:
Fossil dependence & emissions: Despite growth in clean energy, coal still accounts for a large share of generation and emissions.
Integration of renewables: Variability, storage, grid balancing are key technical & policy challenges.
Financial health of utilities / distribution companies (discoms): Issues with losses, tariffs, subsidy burdens.
Access, reliability: Though electrification is near universal, quality and reliability of supply vary, especially in remote/rural areas
Financial situation:
Recent Performance
| Metric | Value / Observation | Time Period / Notes |
| Gross Debt of DISCOMs | ₹ 7.4 trillion | As of March 2024, up from
₹ 6.6 trillion in March 2023. |
| Aggregate Losses (on a subsidy-billed basis) | ₹ 255,530 million (₹ 255.53 billion) | FY 2023-24; this is a fall from
₹ 594.97 billion in FY 2022-23. |
| Revenue from Operations (incl. subsidies billed) | ₹ 9,605.95 billion ( ₹ 9.6 trillion) | FY 2023-24 for distribution utilities. Previous year: ₹ 8,458.41 billion. |
| Total Expenditure | ₹ 10,652.4 billion ( ₹ 10.65 trillion) | For FY 2023-24. |
| Cost Recovery Ratio | 97.91 % | FY 2023-24. Improved from 94.27% in FY 2022-23. |
| AT&C Losses | Varies widely by state; some utilities have losses > 30-40%; many others around ~15-25%; some states / DISCOMs are doing <15%. | |
| Tariff Subsidies Billed | ₹ 2,107.84 billion (₹ 2.11 trillion) | FY 2023-24. As a % of total revenue, increased from ~17.56% in FY2022-23 to ~20.21%. |
| Subsidies Received by States | Less than or (in some years) more than billed subsidies; in FY 2023-24 states released 97.4% of billed subsidies vs 108.6% in FY 2022-23. | |
| ACS-ARR Gap (Average Cost of Supply minus Average Revenue Realisation) | Reduced, but still positive in many states (meaning DISCOMs often sell below cost). Eg. gap per unit reduced from ~ Re 0.41/kWh in FY2022-23 to ~ Re 0.15/kWh in FY2023-24. |
Causes of Losses / Financial Stress
From recent reports & research, key root causes are:
High Procurement / Power Purchase Cost
Long-term contracts (PPAs) taken in earlier years that are expensive or less efficient.
Fuel (coal etc.) price escalation.
AT&C losses (Technical + Commercial Losses)
Technical losses due to aging infrastructure, transformer / line losses.
Commercial losses: theft, meter tampering, faulty metering, billing/collection inefficiencies.
Tariffs not always cost-reflective
Residential / agricultural consumption often gets subsidized heavily; these cross-subsidies and delayed subsidy reimbursements hurt cash flows.
Subsidy delays & under-payments
Even when subsidies are promised, states sometimes delay releasing funds. This forces DISCOMs to borrow or accumulate dues.
Working Capital Pressure & Delayed Payments
DISCOMs often have delayed receivables (from consumers, government departments). Also, payables (esp. power purchase expenses) pile up.
Debt Servicing & Old Liabilities
Past accumulated debt (including debts taken over under reform schemes) adds interest and burden.
Improvements, Trends & Policy Measures
While the situation is challenging, some improvements and policy actions of note:
- Reduction in Aggregate Losses: As seen above, the losses (on subsidy billed basis) have almost halved from FY22-23 to FY23-24.
- Better Cost Recovery: Cost recovery ratio has improved (94+ % → ~98 %) between those years.
- Reduction in ACS-ARR gap: Reduced per unit gaps in many states.
- State examples with good performance: Gujarat is repeatedly cited as a state where DISCOMs have improved a lot; some utilities now have low AT&C losses and even ACS-ARR surplus.
- Policy & Reform Programs:
UDAY (Ujwal DISCOM Assurance Yojana) — financial turnaround scheme begun in 2015.
Revamped Distribution Sector Scheme (RDSS) — newer schemes to push efficiency, modernisation, smart meters etc. (though challenges in implementation remain).
- Tariff Adjustments: Many states have increased tariffs, though sometimes modestly, to better reflect costs.
Remaining Challenges & Risks
Even with improvements, the following remain significant:
- Many DISCOMs still do not fully cover cost of supply; significant gaps remain in many states.
- AT&C losses are still high in many parts, particularly rural, agricultural, and in some Northeast / remote states.
- The dependency on subsidies will persist; state governments must continue fund release timely.
- Debt burden remains large; servicing it reduces ability to invest in grid improvements, technology, storage, etc.
- Delay in regulatory / tariff orders in some states slows alignment.
- Inflation, coal/fuel price shocks, currency risks (for imported fuel) may hurt costs further.
XOX